Methods
Figma
Group Work
Product Designer*1
Engineers*3
My Contributions
Product Design
User Research
Product Management
Areas
Data Visualization
Backend Platform
OVERVIEW
A Backend Bike Parking Analytics and Operation Platform For Netherlands Municipality
The backend bike parking management platform is designed to assist municipalities in the Netherlands with analyzing and monitoring data related to bike parking facilities. By leveraging data insights, municipalities can improve urban mobility and enhance the cycling experience for residents.
Creating an End-to-End Parking Operations Workflow
A streamlined workflow that helps operators move from identifying parking issues to coordinating removals and tracking operational outcomes, reducing manual analysis and improving response efficiency.
Simulate tests to identify the best solution
Simulate tests using the UDES Model to evaluate and identify optimal solution locations with precision and efficiency. This approach leverages data-driven insights to analyze potential outcomes and select the most effective locations for implementation.
BACKGROUND
Chaotic bike parking with the help of the Street Scanning Cars
Since biking is so common in the Netherlands, managing bike parking has become a challenge. People often leave their bikes in crowded or unorganized areas. To address this, municipalities are using street-scanning cars to collect data on parking conditions and identify areas that need attention.
OUR CLIENTS
STAKEHOLDER INTERVIEW
Identifying the Primary User in a Multi-Stakeholder System
Stakeholder interviews revealed a complex ecosystem involving municipalities, removal companies, storage hubs, and cyclists. While multiple groups influence the bike removal process, field operators sit at the center of the workflow—monitoring live parking data, coordinating removal operations, and tracking outcomes. This insight led us to define field operators as the MVP user.
CURRENT PLATFORM
The current platform cannot support evolving operational needs
Difficult to identify operational hotspots
The current dashboard relies heavily on tables and isolated metrics, making it difficult for operators to quickly identify patterns and prioritize issues.
Fragmented workflow across platforms
Issue monitoring, table analysis, and progress tracking are managed across separate platforms, creating operational friction and reducing visibility into end-to-end issue resolution.
Limited foundation for future expansion
The existing structure was designed for basic reporting and lacks the flexibility to support new workflows, user roles, and future operational planning capabilities.
MVP USER
TECH CONSTRAINTS
Large-scale geospatial datasets
· Thousands of parking locations and bike records
· Maintain map performance and loading speed
· Preserve data trust and accuracy while aggregating information
Ambiguous user scope
The platform was initially for municipalities, but the primary user and workflow were not clearly defined. We prioritized Field Operators while designing a flexible framework that could scale to future multi stakeholders.
Field Operator
monitor parking conditions; check parking issues; assign removal operations; track issue resolution.
Requirement 01
Quickly identify areas requiring attention
Requirement 02
Coordinate removal operations
Requirement 03
Support operational decision-making
PROBLEM STATEMENT
How might we help field operators identify parking hotspots, understand their causes, and take appropriate action?
Decision Tree MVP
We focused on operational issues first because teams could take action on them right away, helping us prove the value of the workflow before exploring long-term capacity planning.
IA
Structure IA based on user flow and leave enough space for future expansion
EXPLORATION
How to show the bike parking information effectively?
The design of lists of cards was dropped and a map visualization was incorporated with a comprehensive dashboard with rankings to offer intuitive geographical insights and ensure a target-oriented and actionable display of performance metrics.
SCENARIOS
With IA and UI exploration, I designed wireframes based on different user scenarios. We prioritized the end-to-end user flow from monitor to task assignment for deeper design exploration.
REQUIREMENTS ITERATION
Before 01
Quickly identify areas requiring attention
Before 02
Coordinate removal operations
Before 03
Support operational decision-making
REQUIREMENTS ITERATION
After 01
Improve efficiency for monitoring and locating issues
After 02
Clarify issue analysis towards operational decision-making
After 03
Automate task assignment and track resolution progress
CLIENT FEEDBACK
The initial prototype improved visibility into parking data, so after review, stakeholders clarified more details and support for every user steps
KEY DESIGN DECISIONS 01
Prioritize actionable insights over raw data, helping operators quickly identify hotspots
Requirements 01
Improve efficiency for monitoring and locating issues
ITERATION 01
Organize metrics around decisions, not datasets
Instead of displaying isolated metrics, related indicators were grouped together to reveal operational conditions and performance trends.
Include contextual information for better comparison and decision-making
Single metrics rarely explain the full situation. Combining overflow rates, district capacity, and operational performance provides the context needed to identify priorities and support decision-making.
Introduce Workflow Features to Support Action Taking
Added messaging and task management capabilities to bridge the gap between identifying issues and executing operational responses.
Information Density vs Actionability
I shifted the dashboard from data reporting to operational prioritization. One key insight was that operators didn't struggle with a lack of data, they struggled with turning data into action. Rather than adding more metrics, I focused on helping users identify where to investigate first and what actions should be taken next.
KEY DESIGN DECISION 02
Introduce map-based visualization to connect parking conditions with geographic context
Requirements 01 & 02
Improve efficiency for monitoring and locating issues; Clarify issue analysis towards operational decision-making
ITERATION 02
Locate issues through spatial visualization and analyze them in context.
Previously, users viewed both the overview and detailed data in a single table, making it difficult to identify where to start. By separating the workflow into map-based hotspot discovery and detailed analysis, users could understand locations faster and investigate issues more effectively.
Overview vs Detail
Based on the users' mental model, I traded thorough visibility for faster issue discovery by introducing a progressive drill-down workflow.
DATA VISUALIZATION
Evaluating different approaches for spatial visualization
Operators needed to quickly identify parking hotspots without being overwhelmed by individual bike records and administration area.
Designing Different Visualization Based on Data Granularity
Unracked Bikes: Grid. "Where should I pay attention to?"
Available Racks: Facility Area. "Are there available racks around?"
Critical Infrastructure: Point of Interest. "Are there accessibility facility around?"
Consistency vs Information Efficiency
Instead of using a unified visualization pattern, I selected the most effective representation for each data type to improve information efficiency and support faster issue assessment. Different goals require different visual representations.
KEY DESIGN DECISION 03
Reduce cognitive load through assisted decision-making
Requirements 02 & 03
Clarify issue analysis towards operational decision-making; Automate task assignment and track resolution progress
AUTOMATION PRIORITIZATION
Identifying automation opportunities across the operational workflow
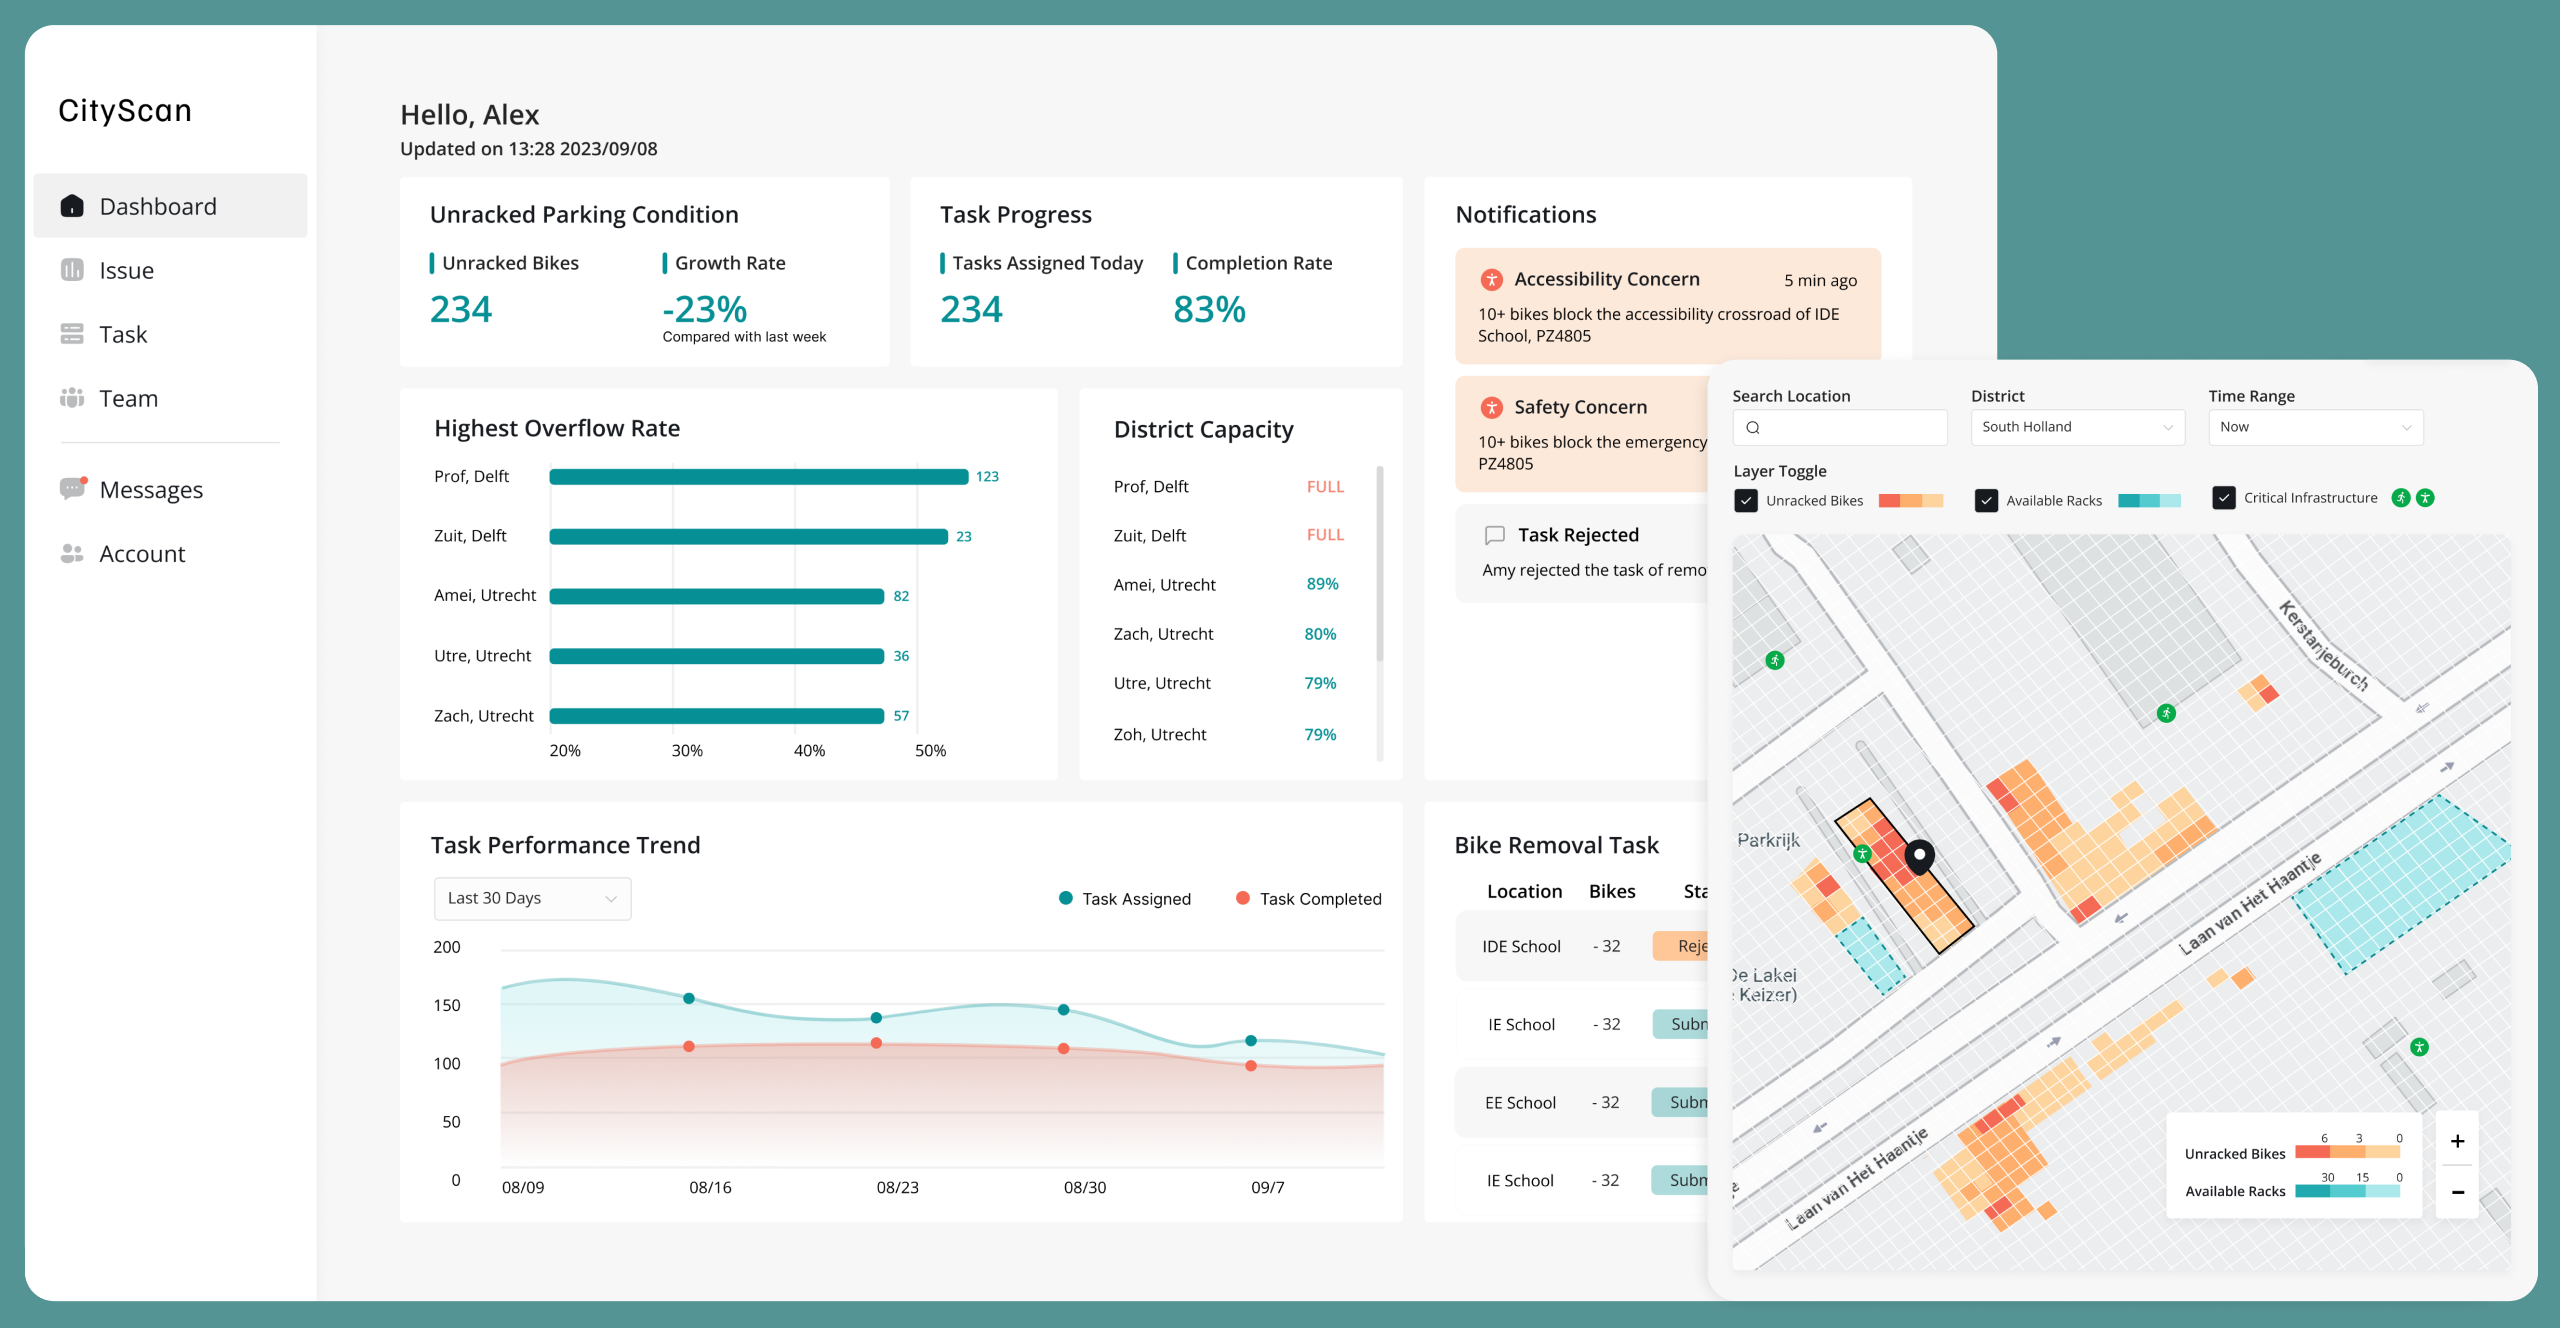
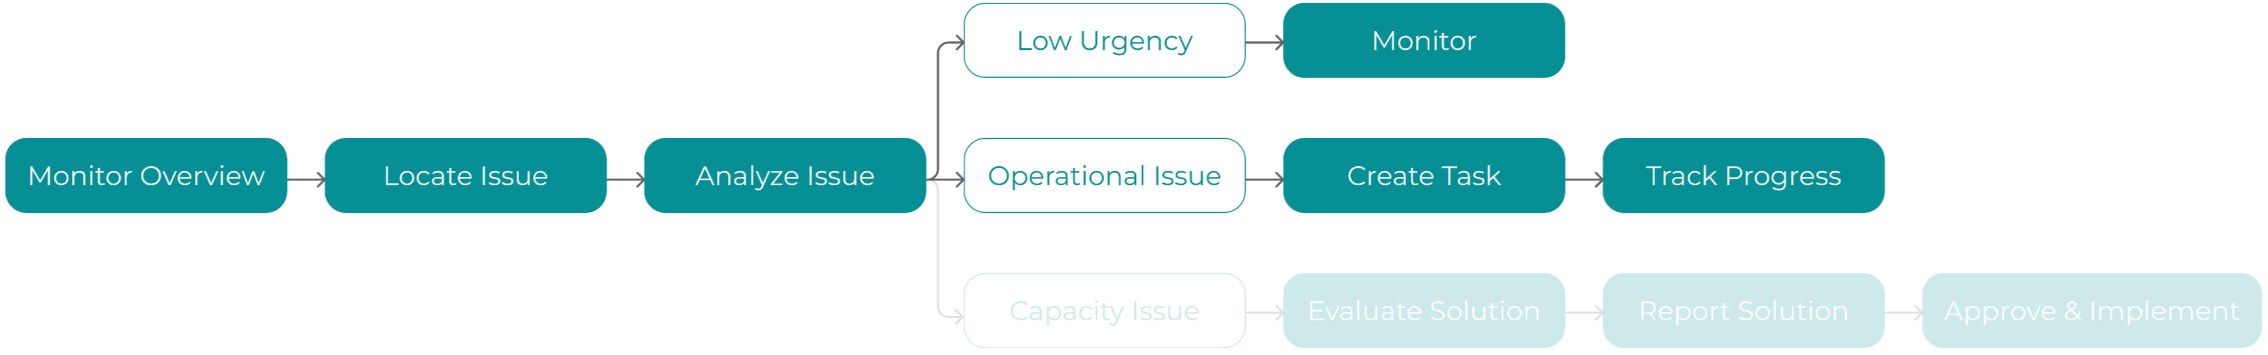
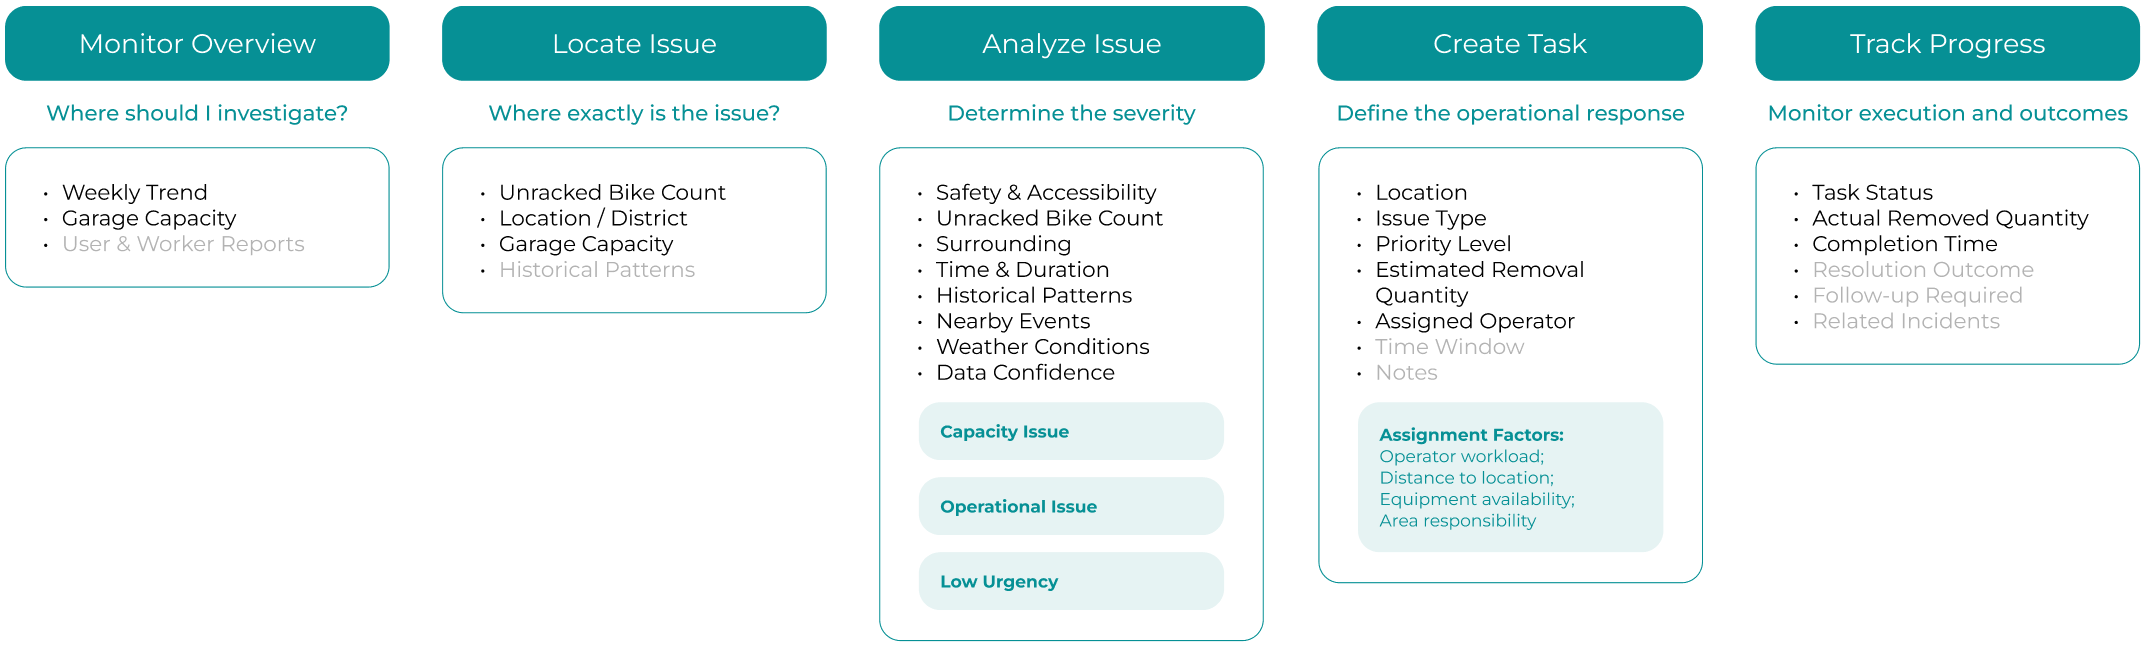
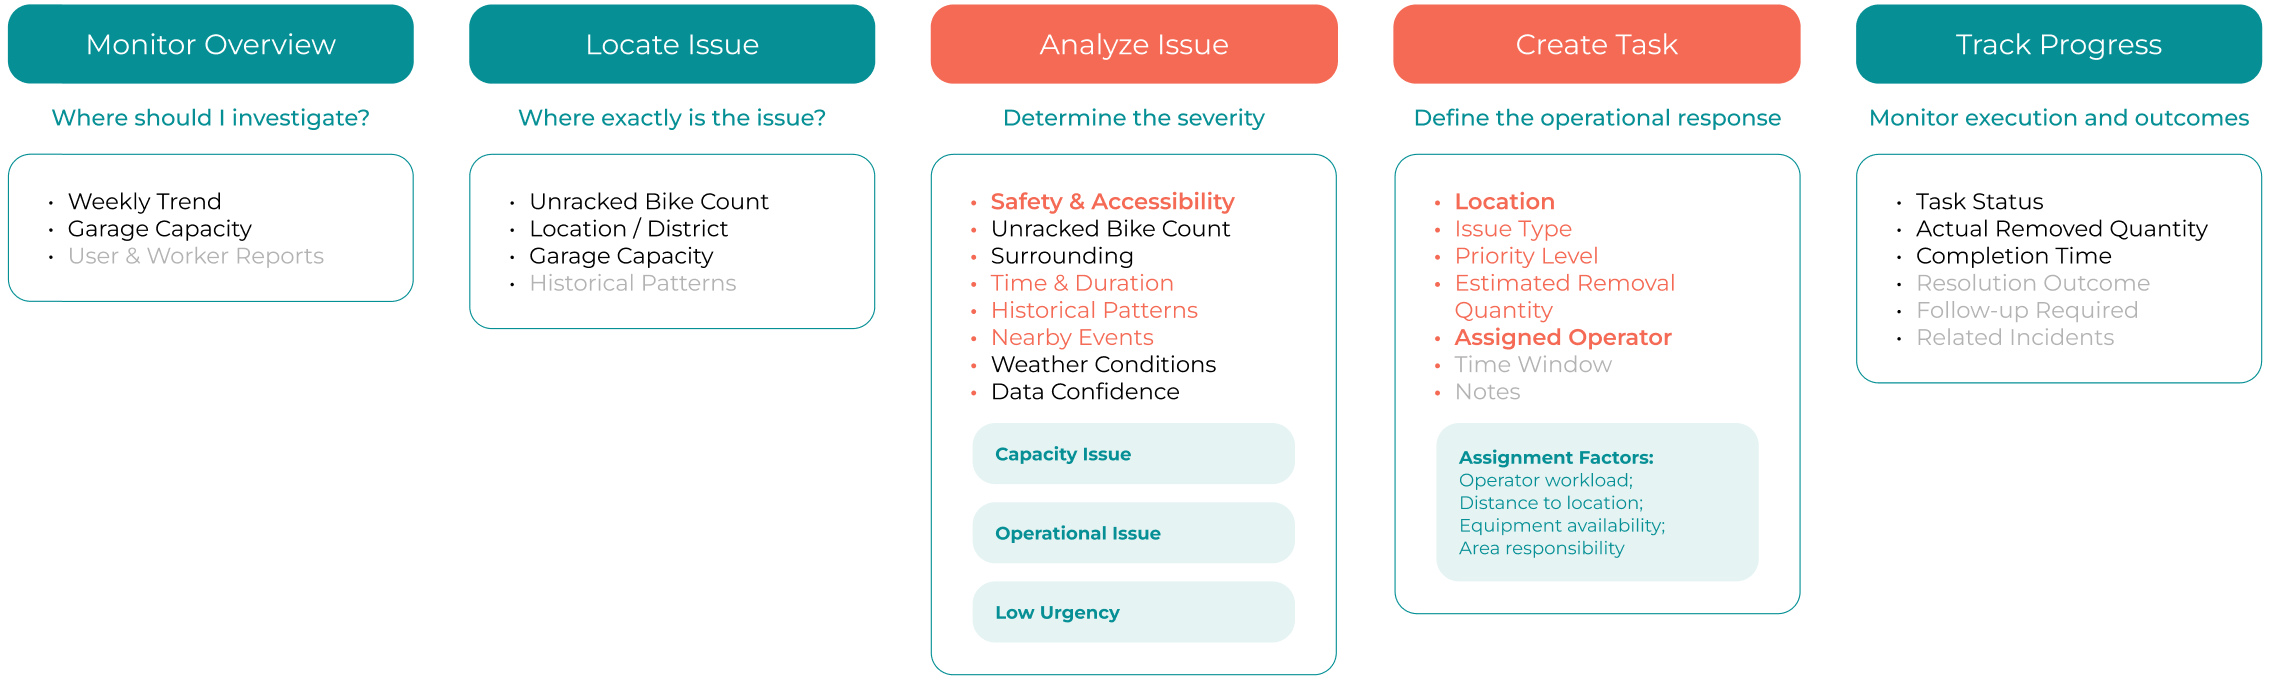
Since issue analysis and task creation require evaluating multiple metrics, they present strong opportunities for automation. To maintain user trust and control, we didn't automate the whole process. Automation was prioritized for safety, accessibility, and operator assignment processes.
Prioritization Logic
"Low-effort changes but make our client see the potential and get excited."
1. High impact, low risk decisions
2. Repetitive information processing
3. Low effort and good effect for our product
AUTOMATION 01
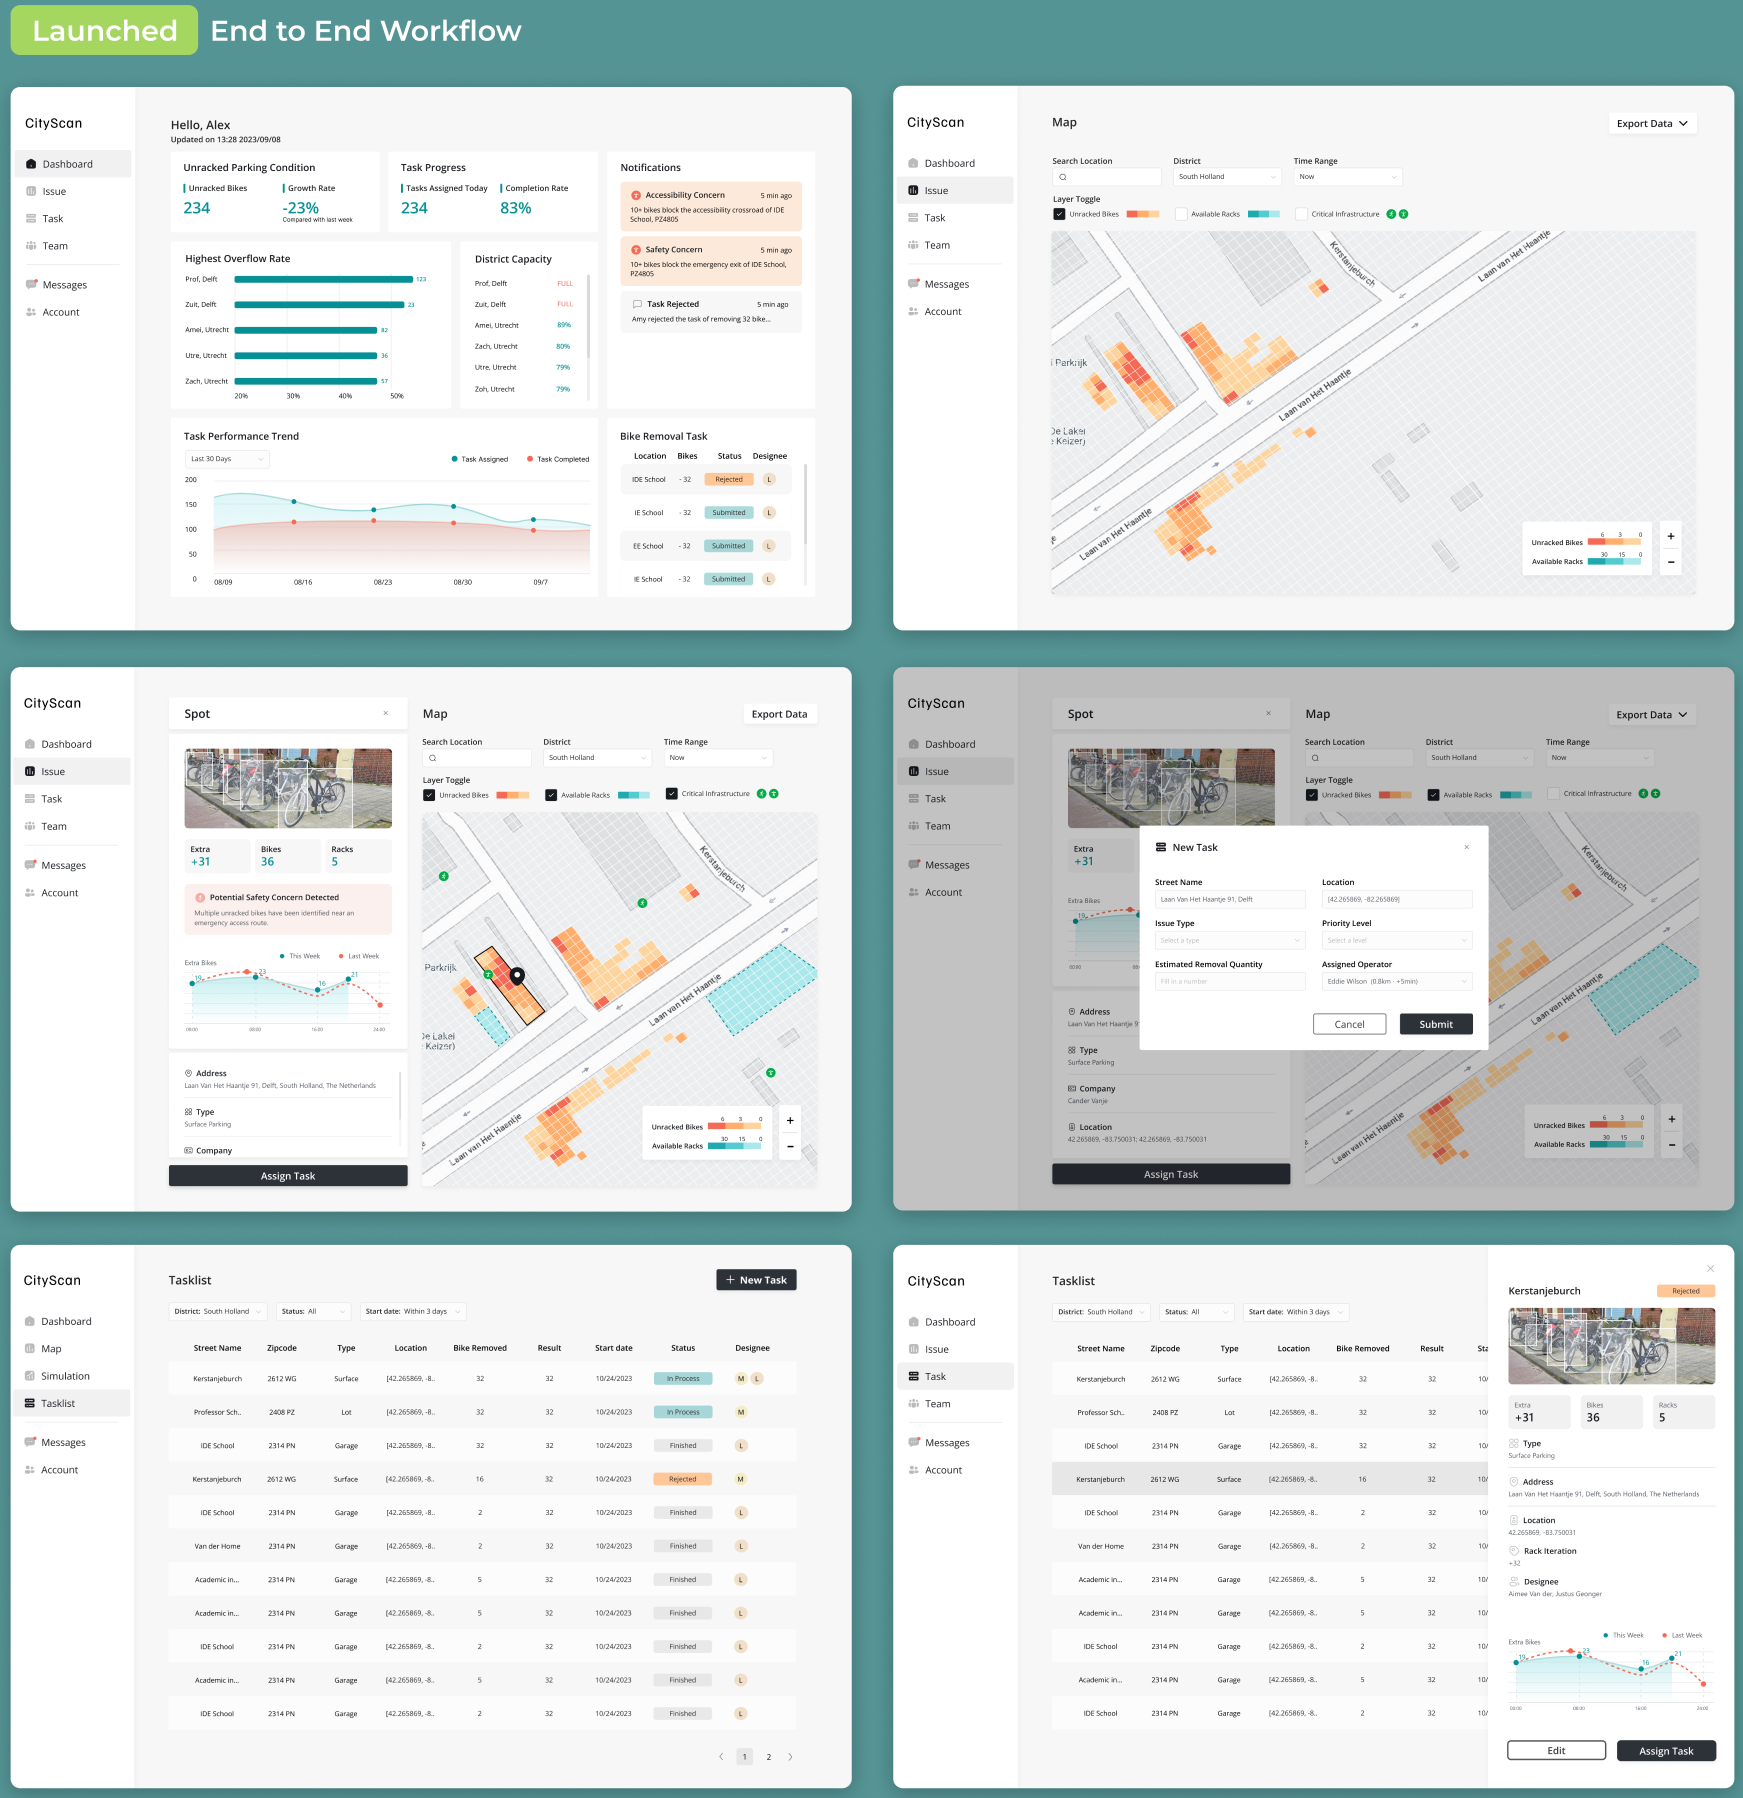
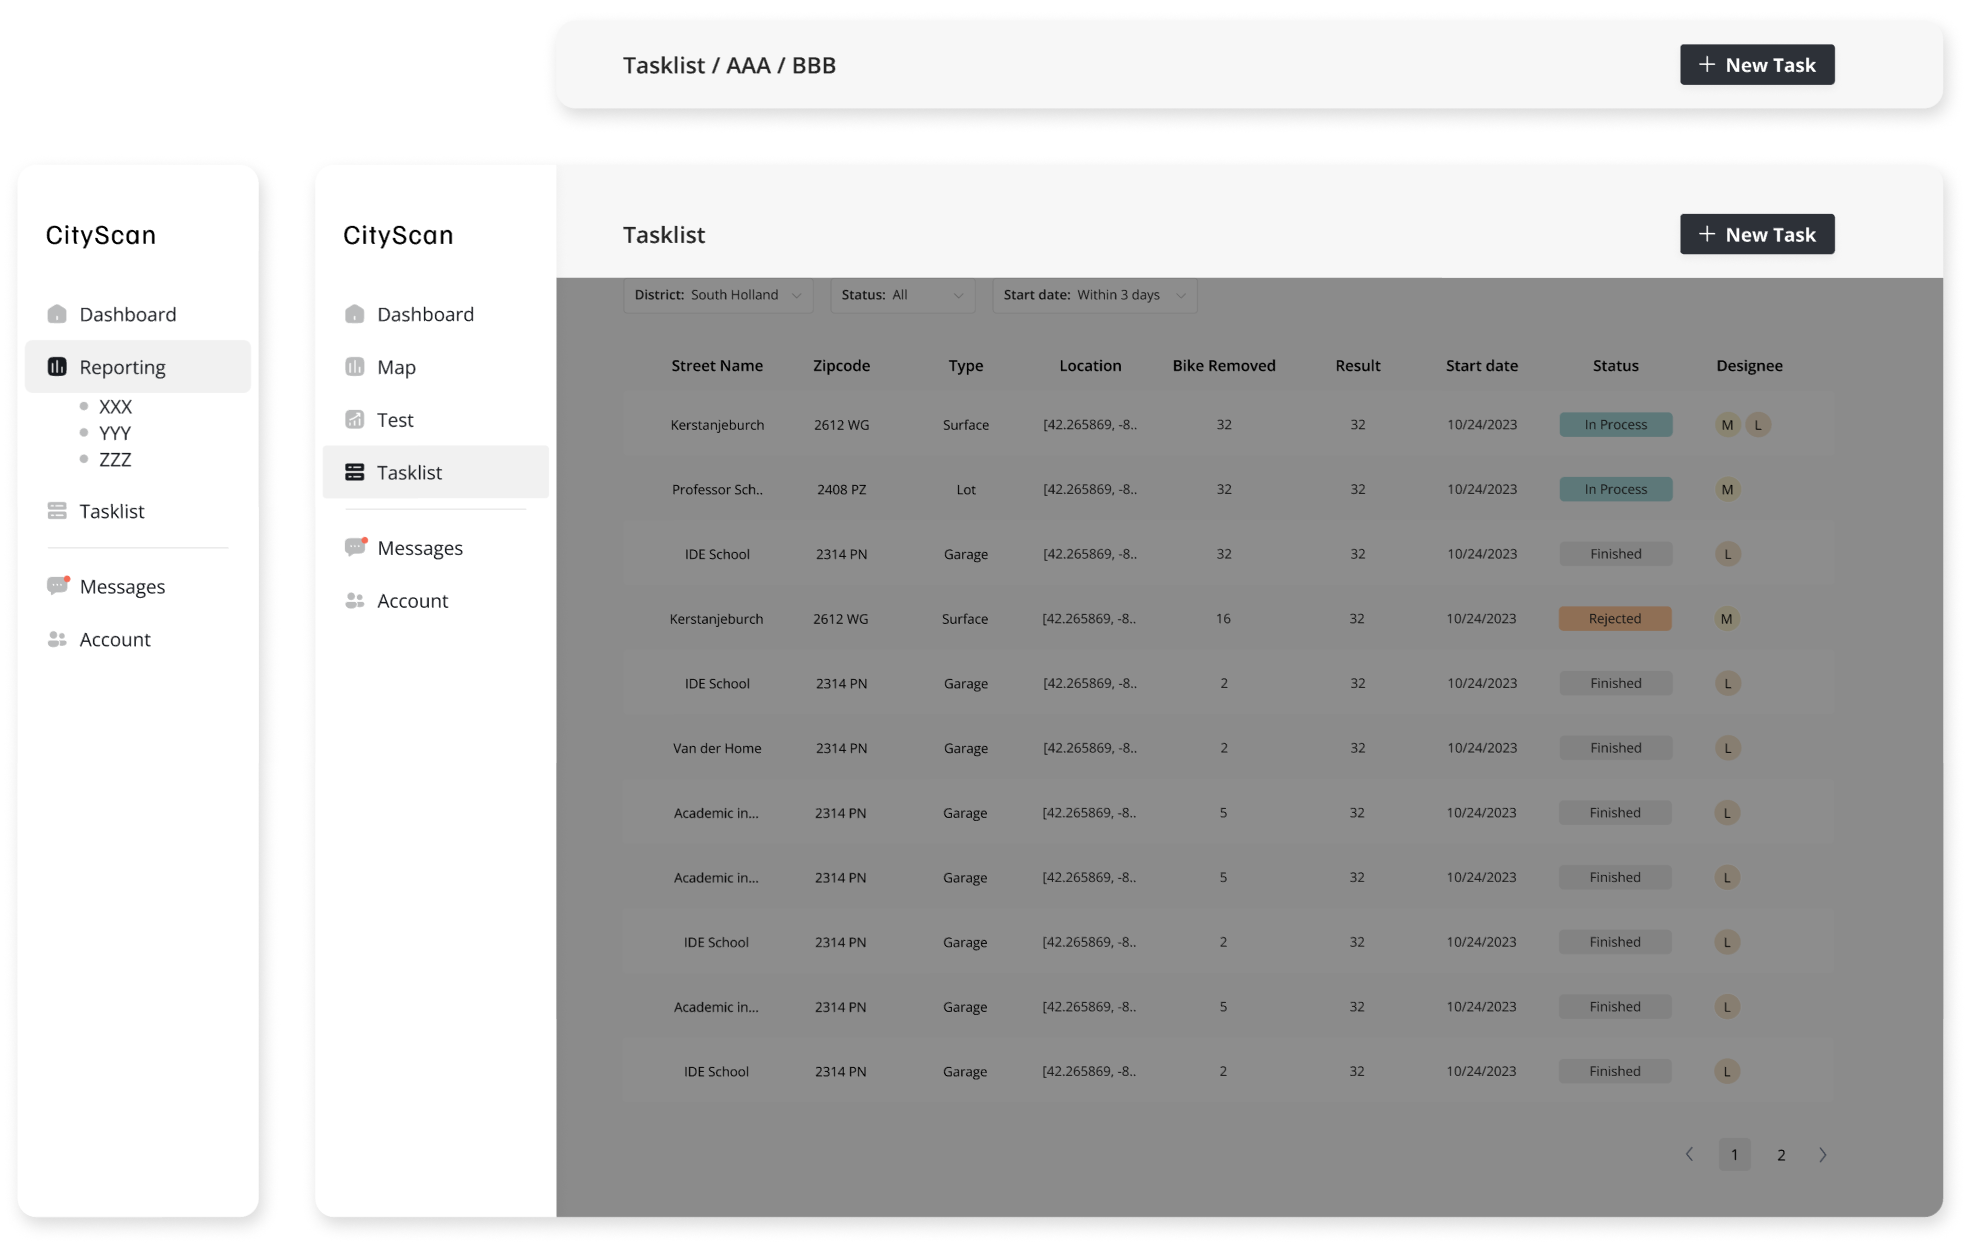
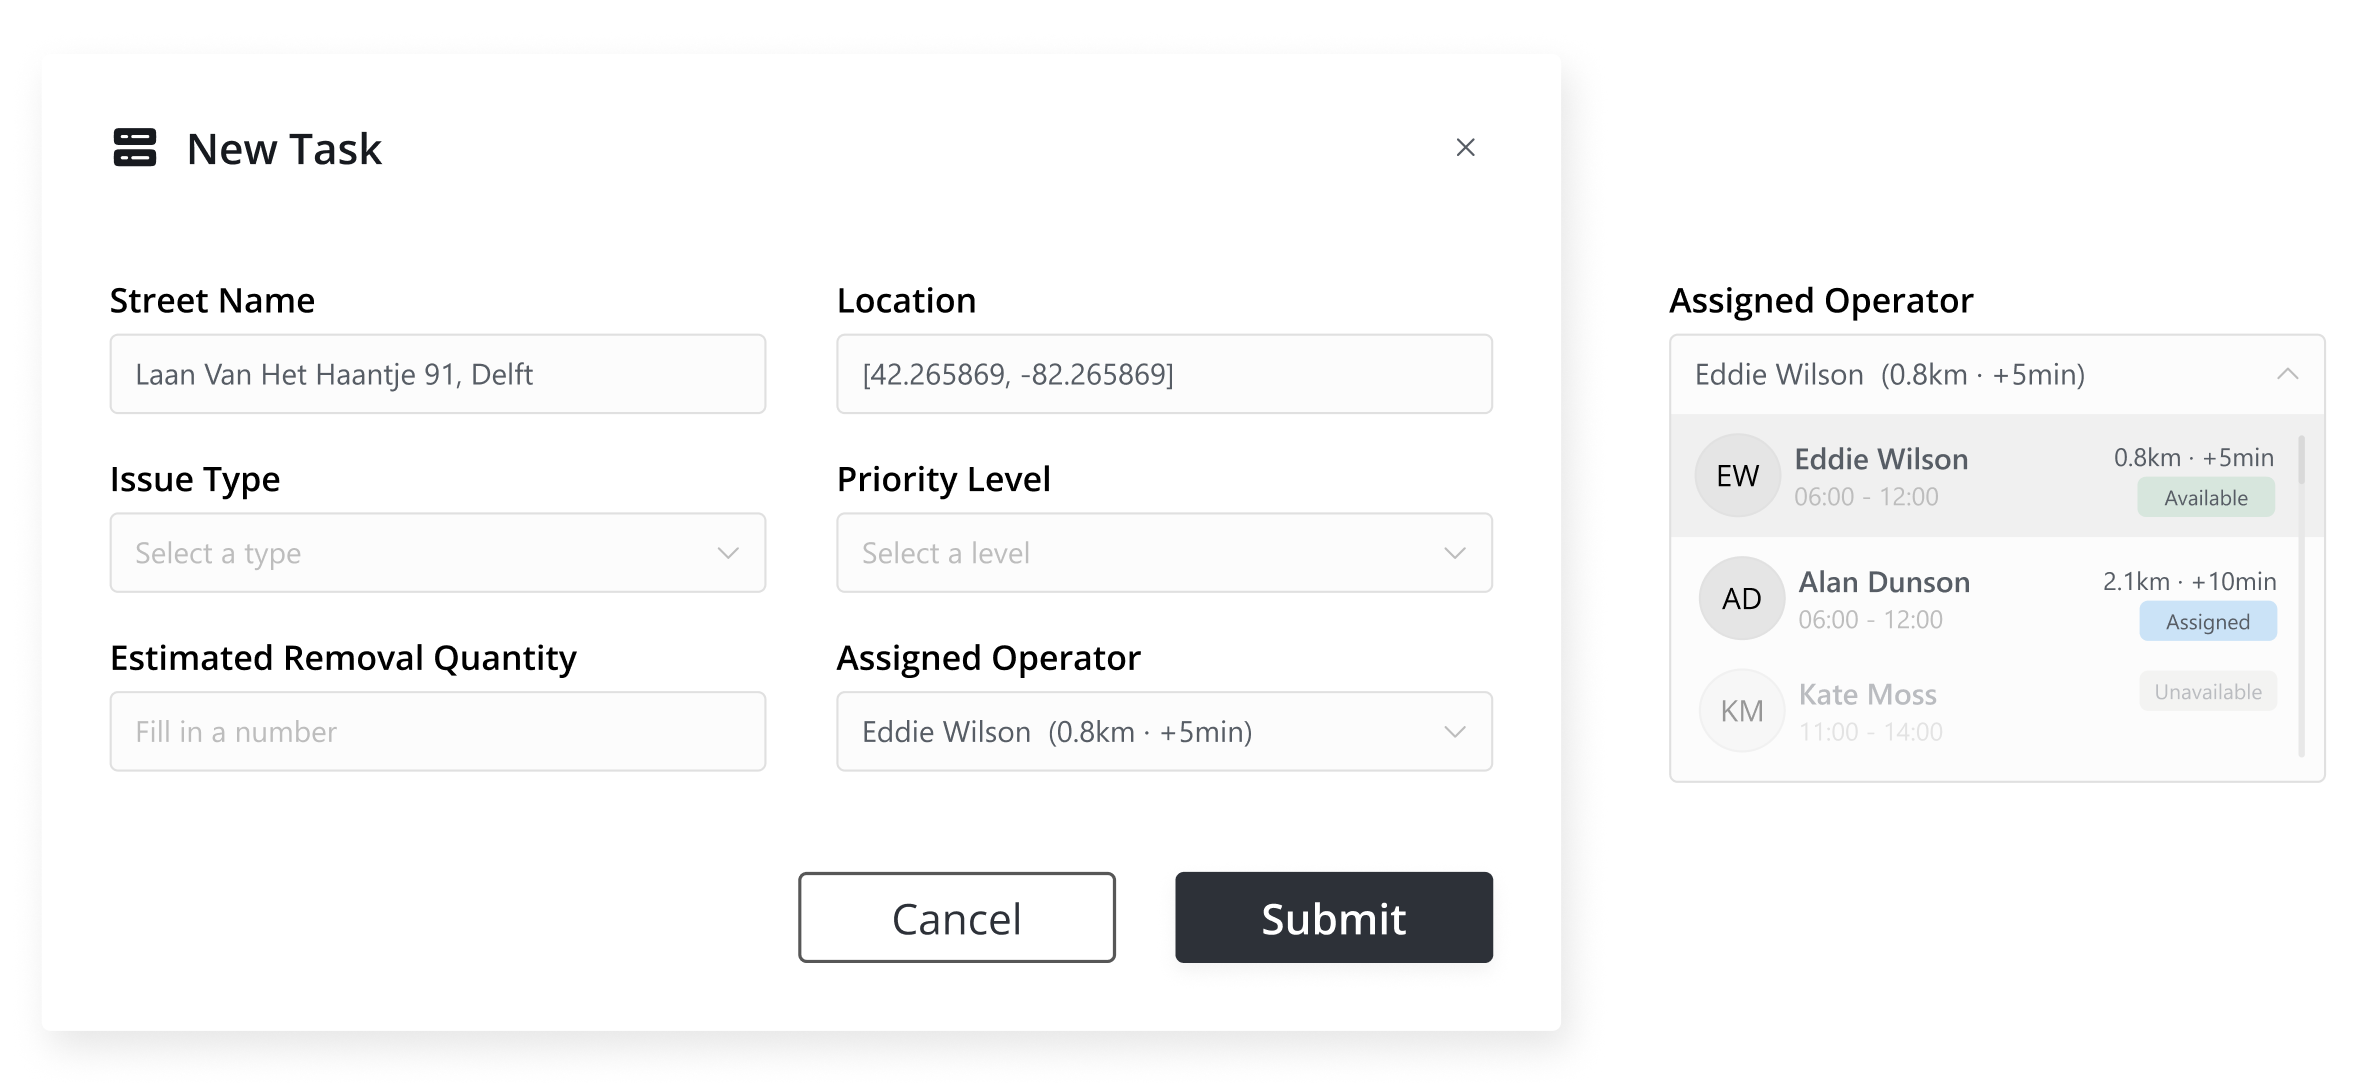
Recommend the best operator for task assignment
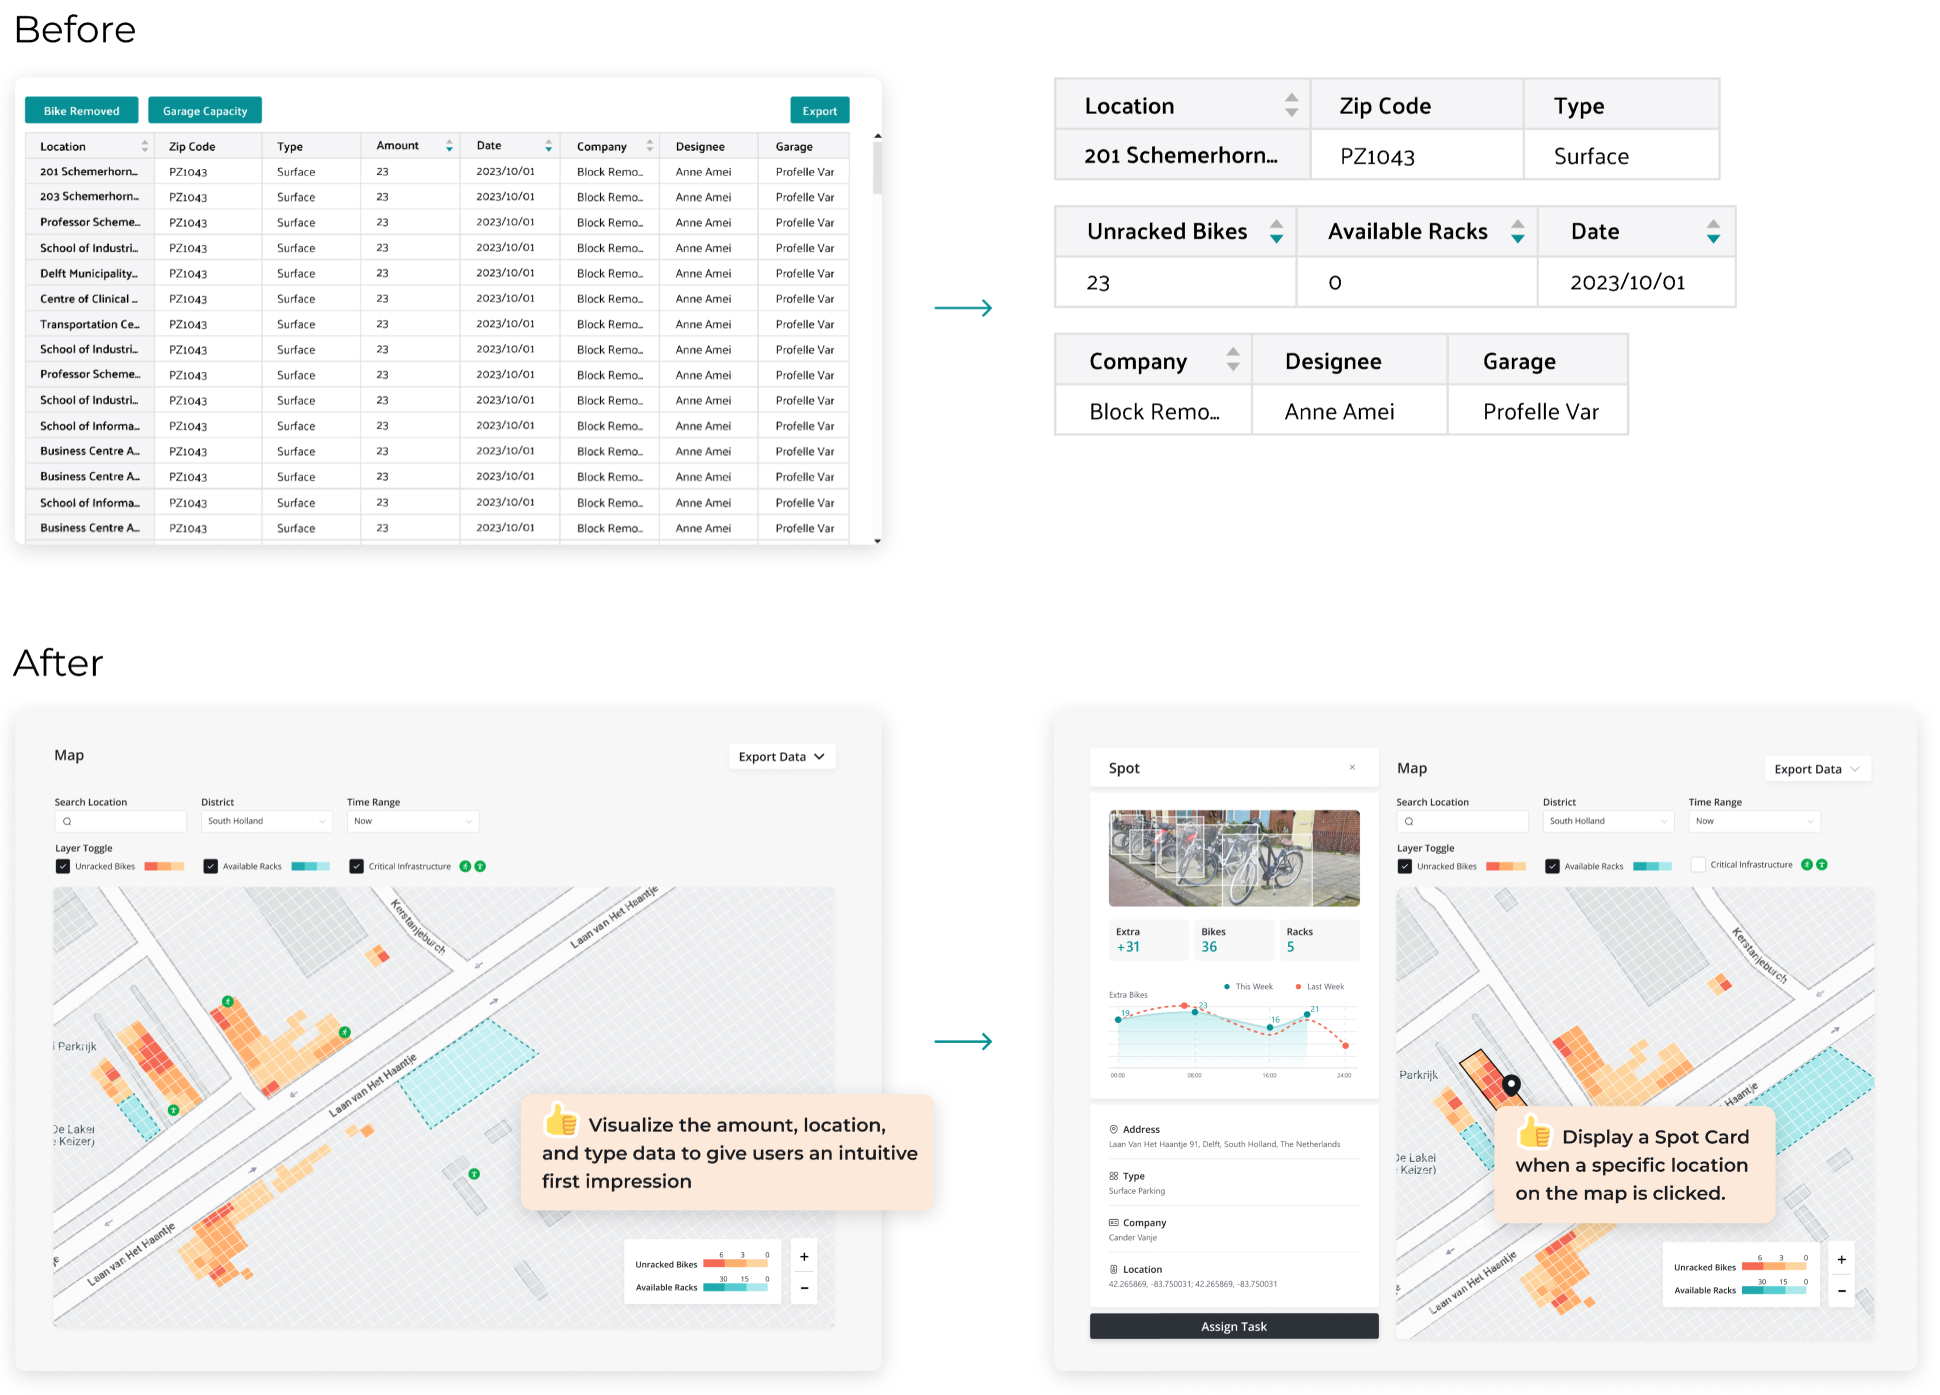
Automatically suggest the most suitable operator based on location proximity, workload, availability, and area responsibility.
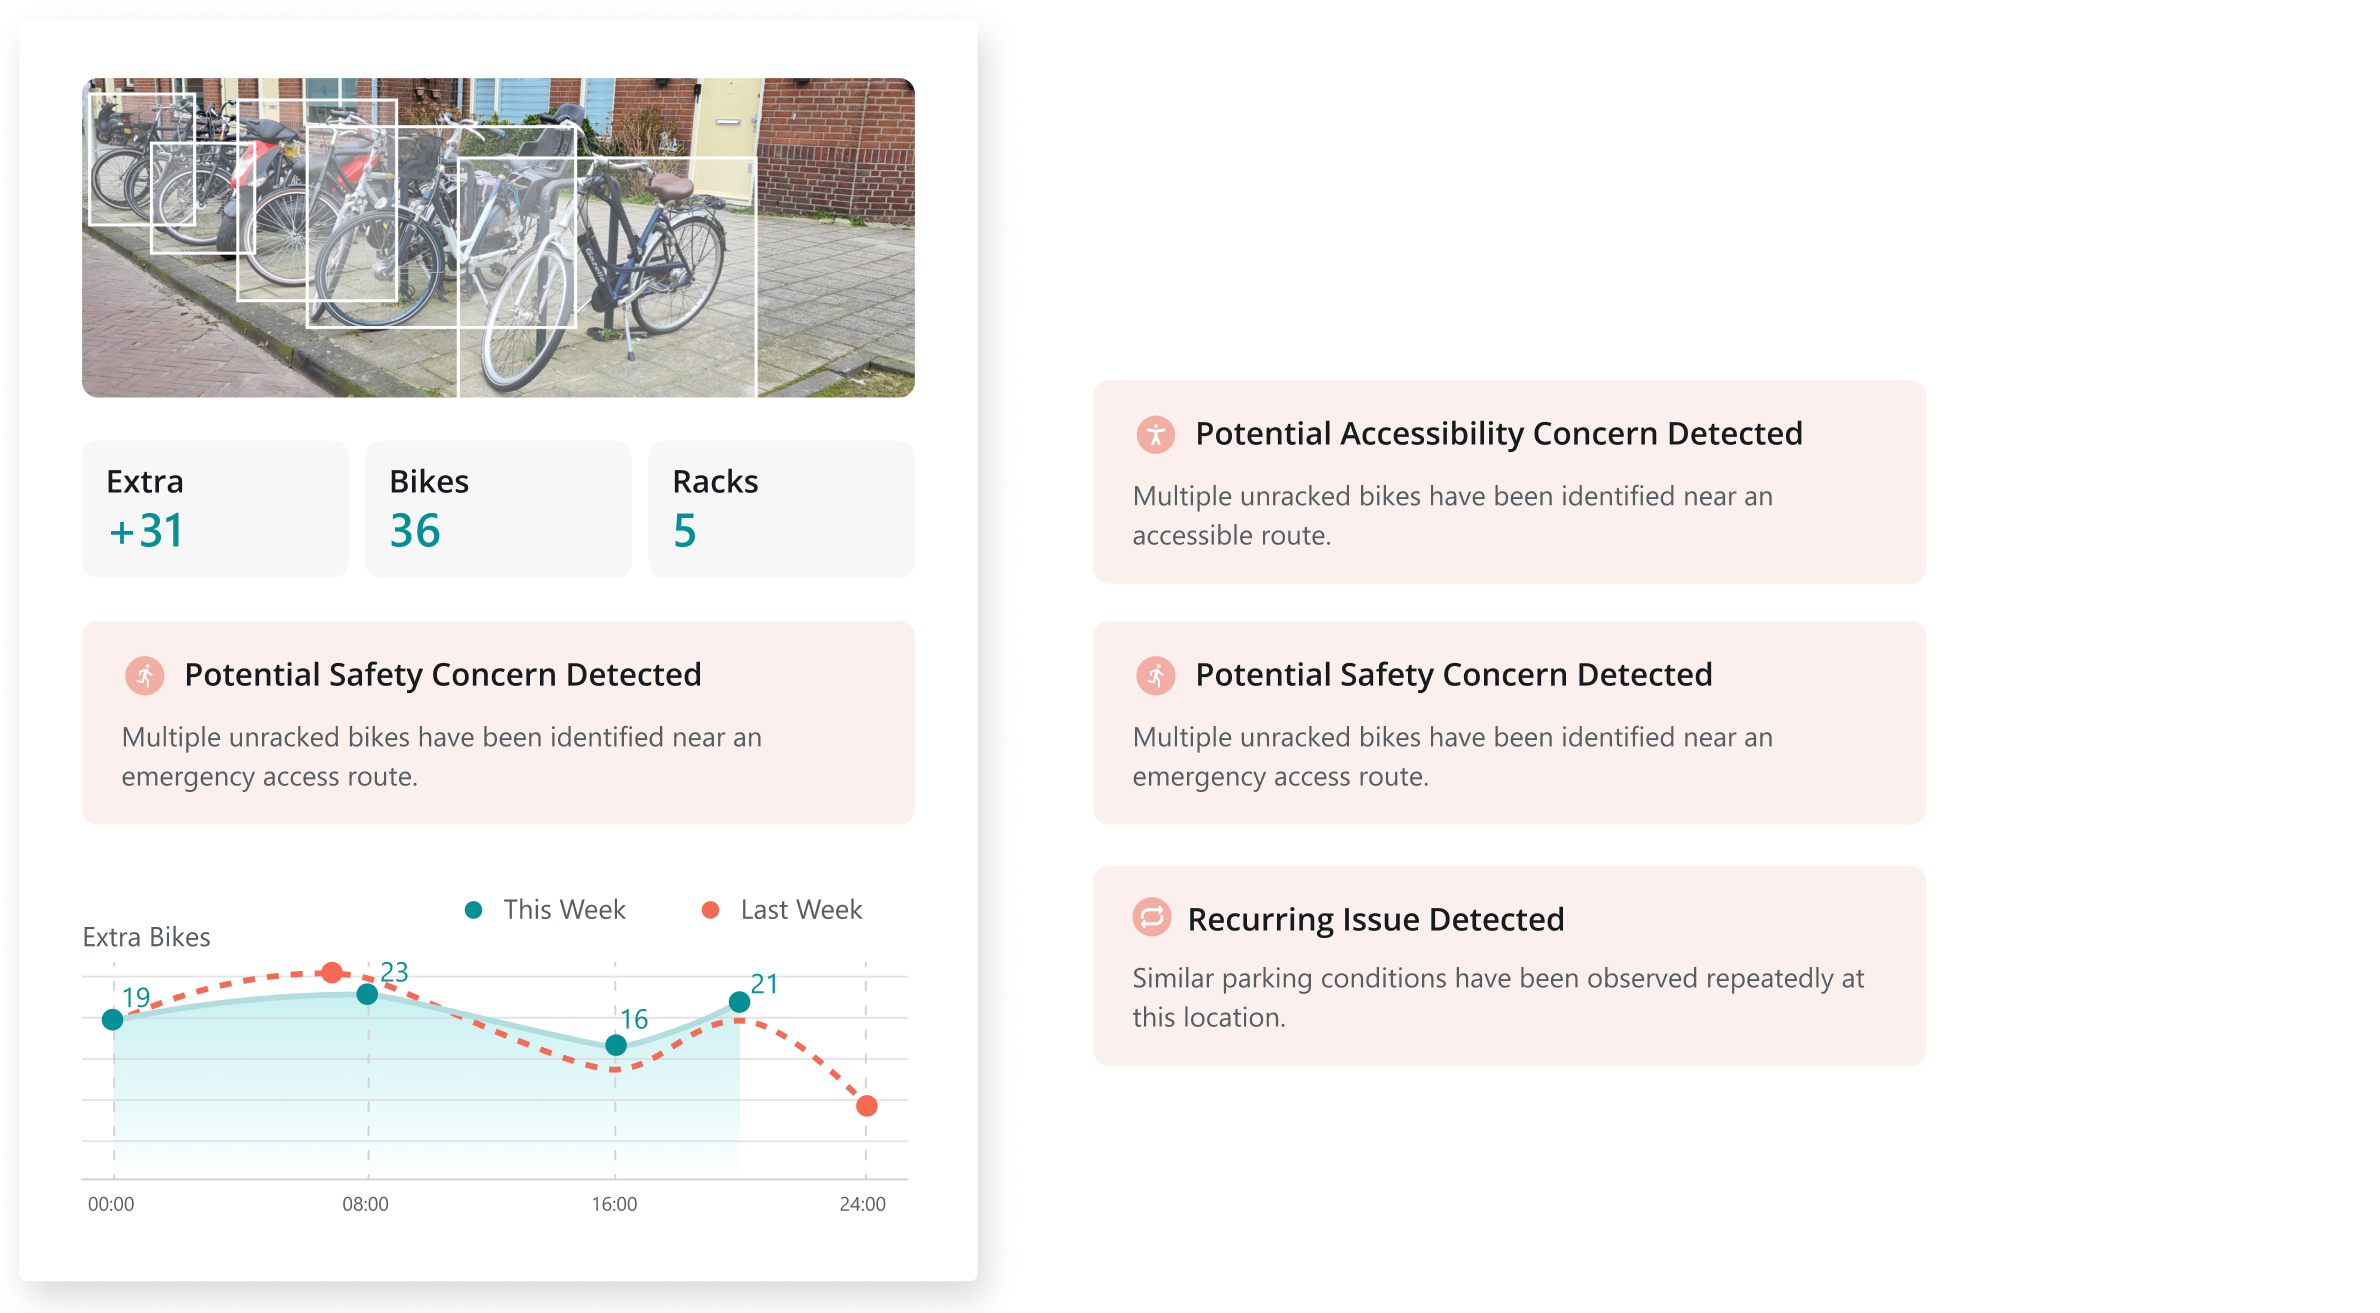
AUTOMATION 02
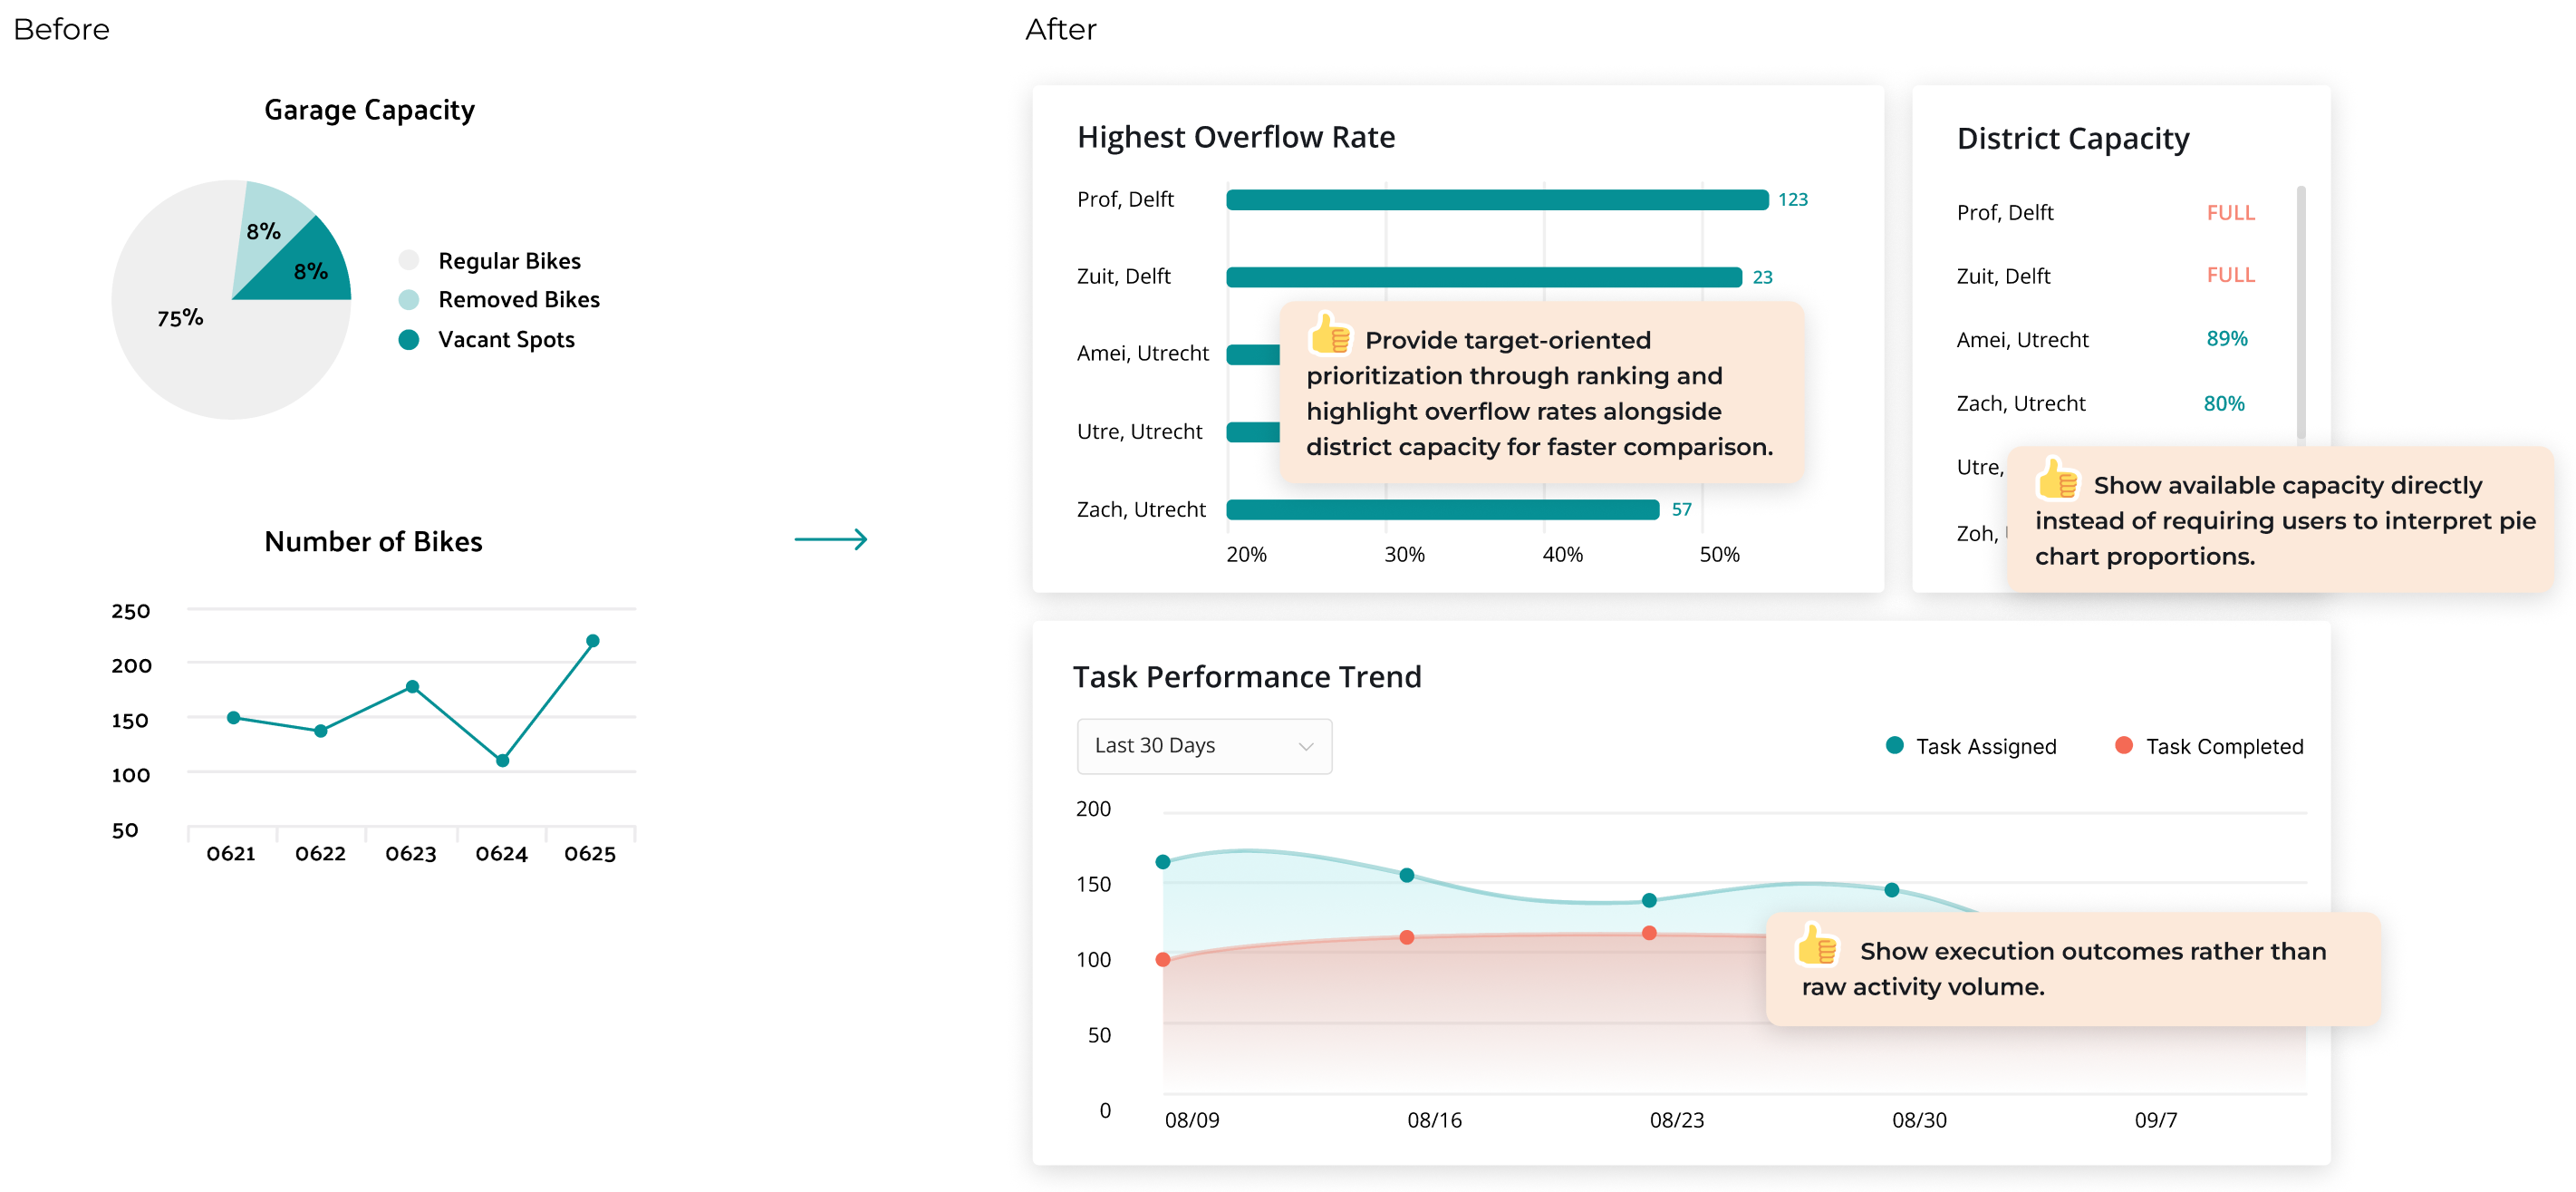
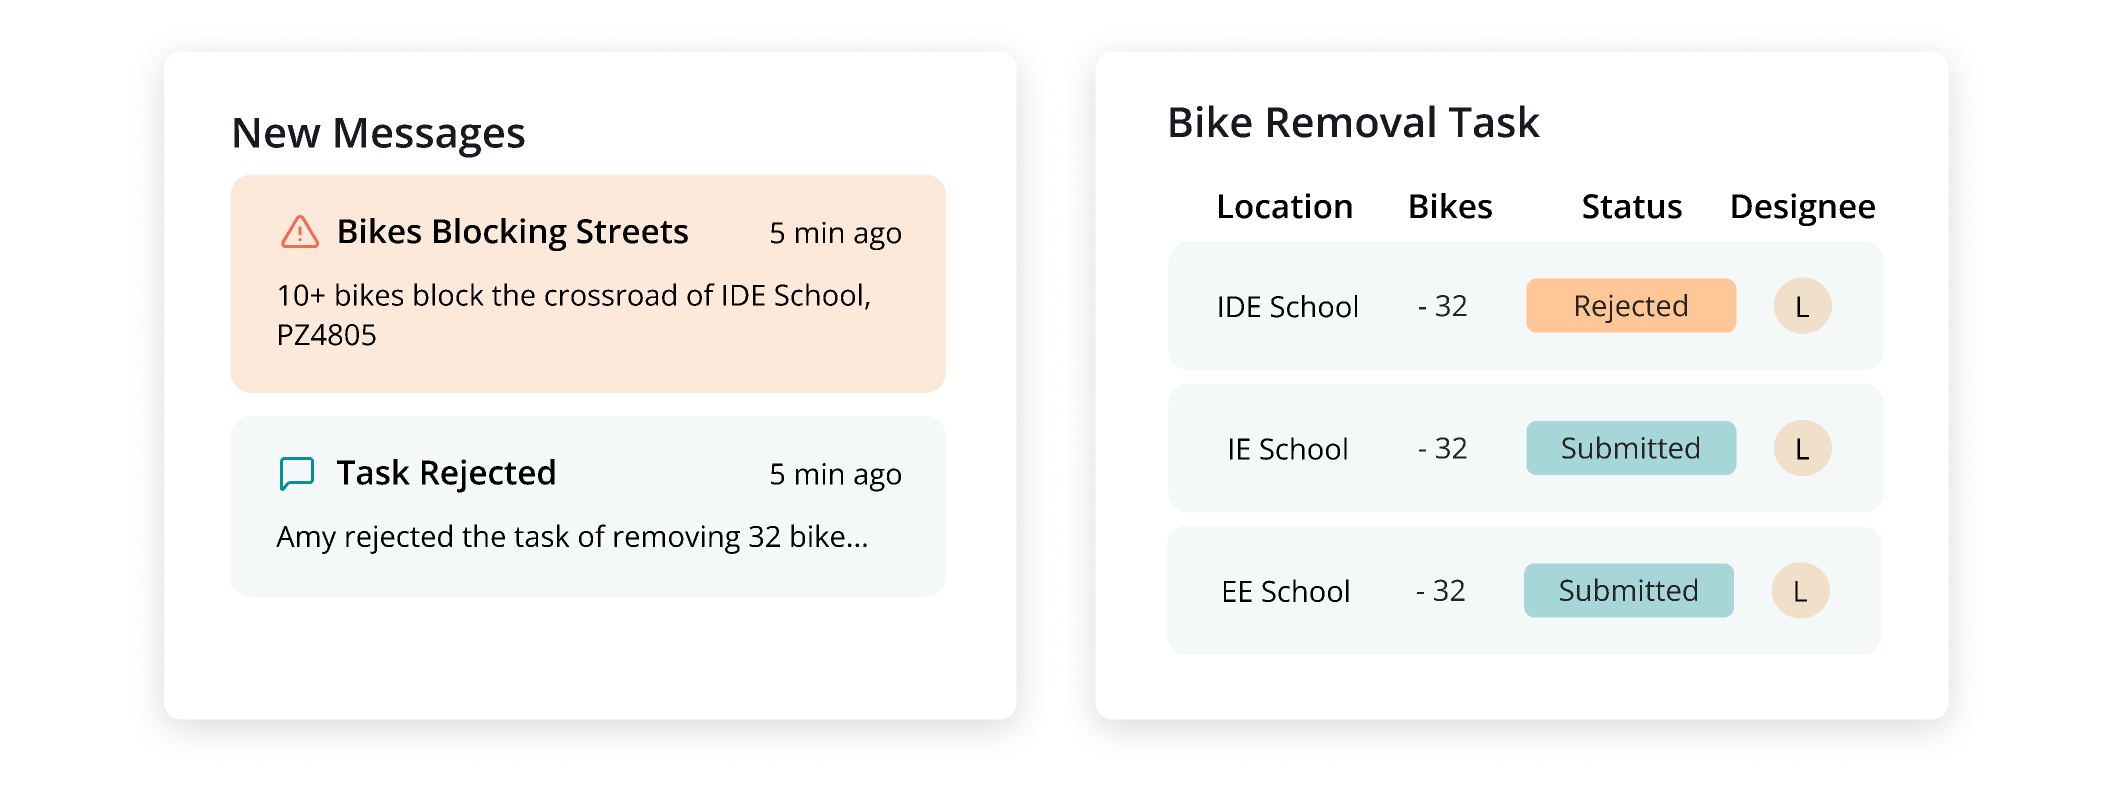
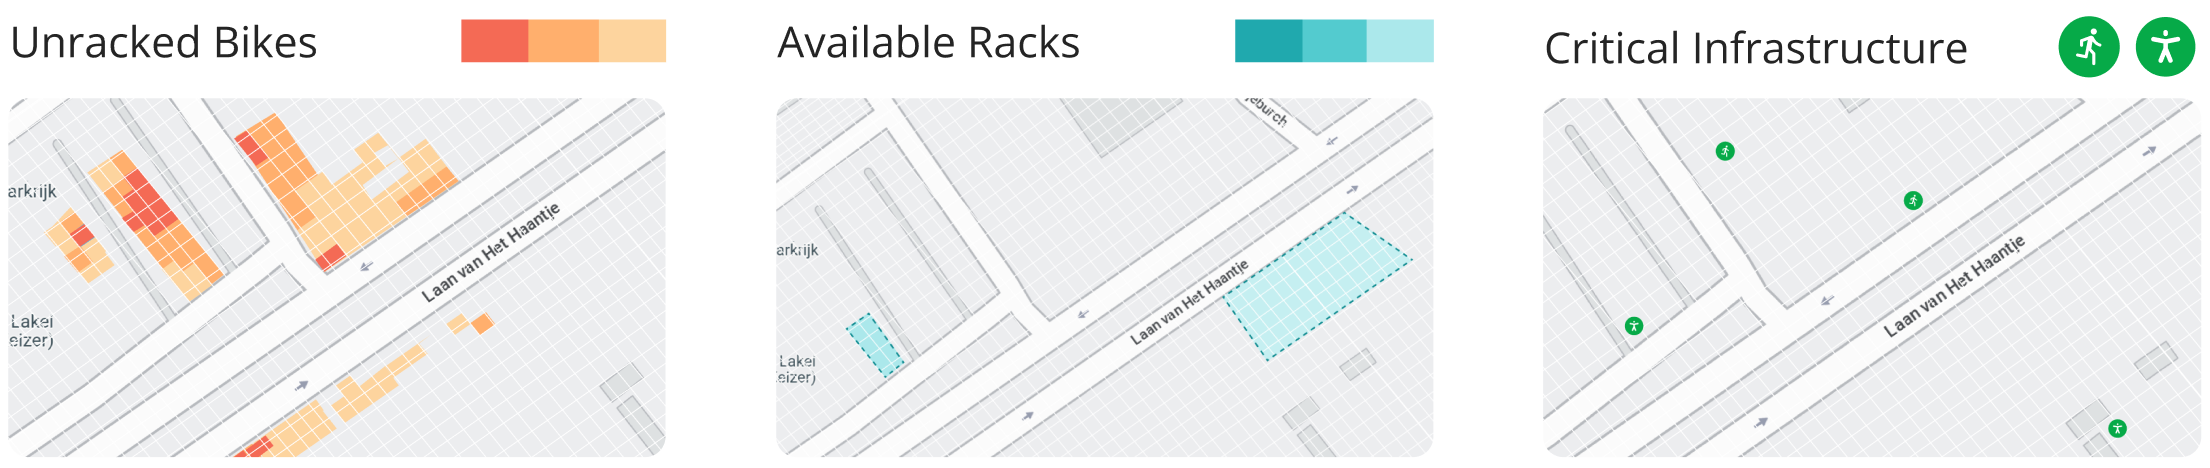
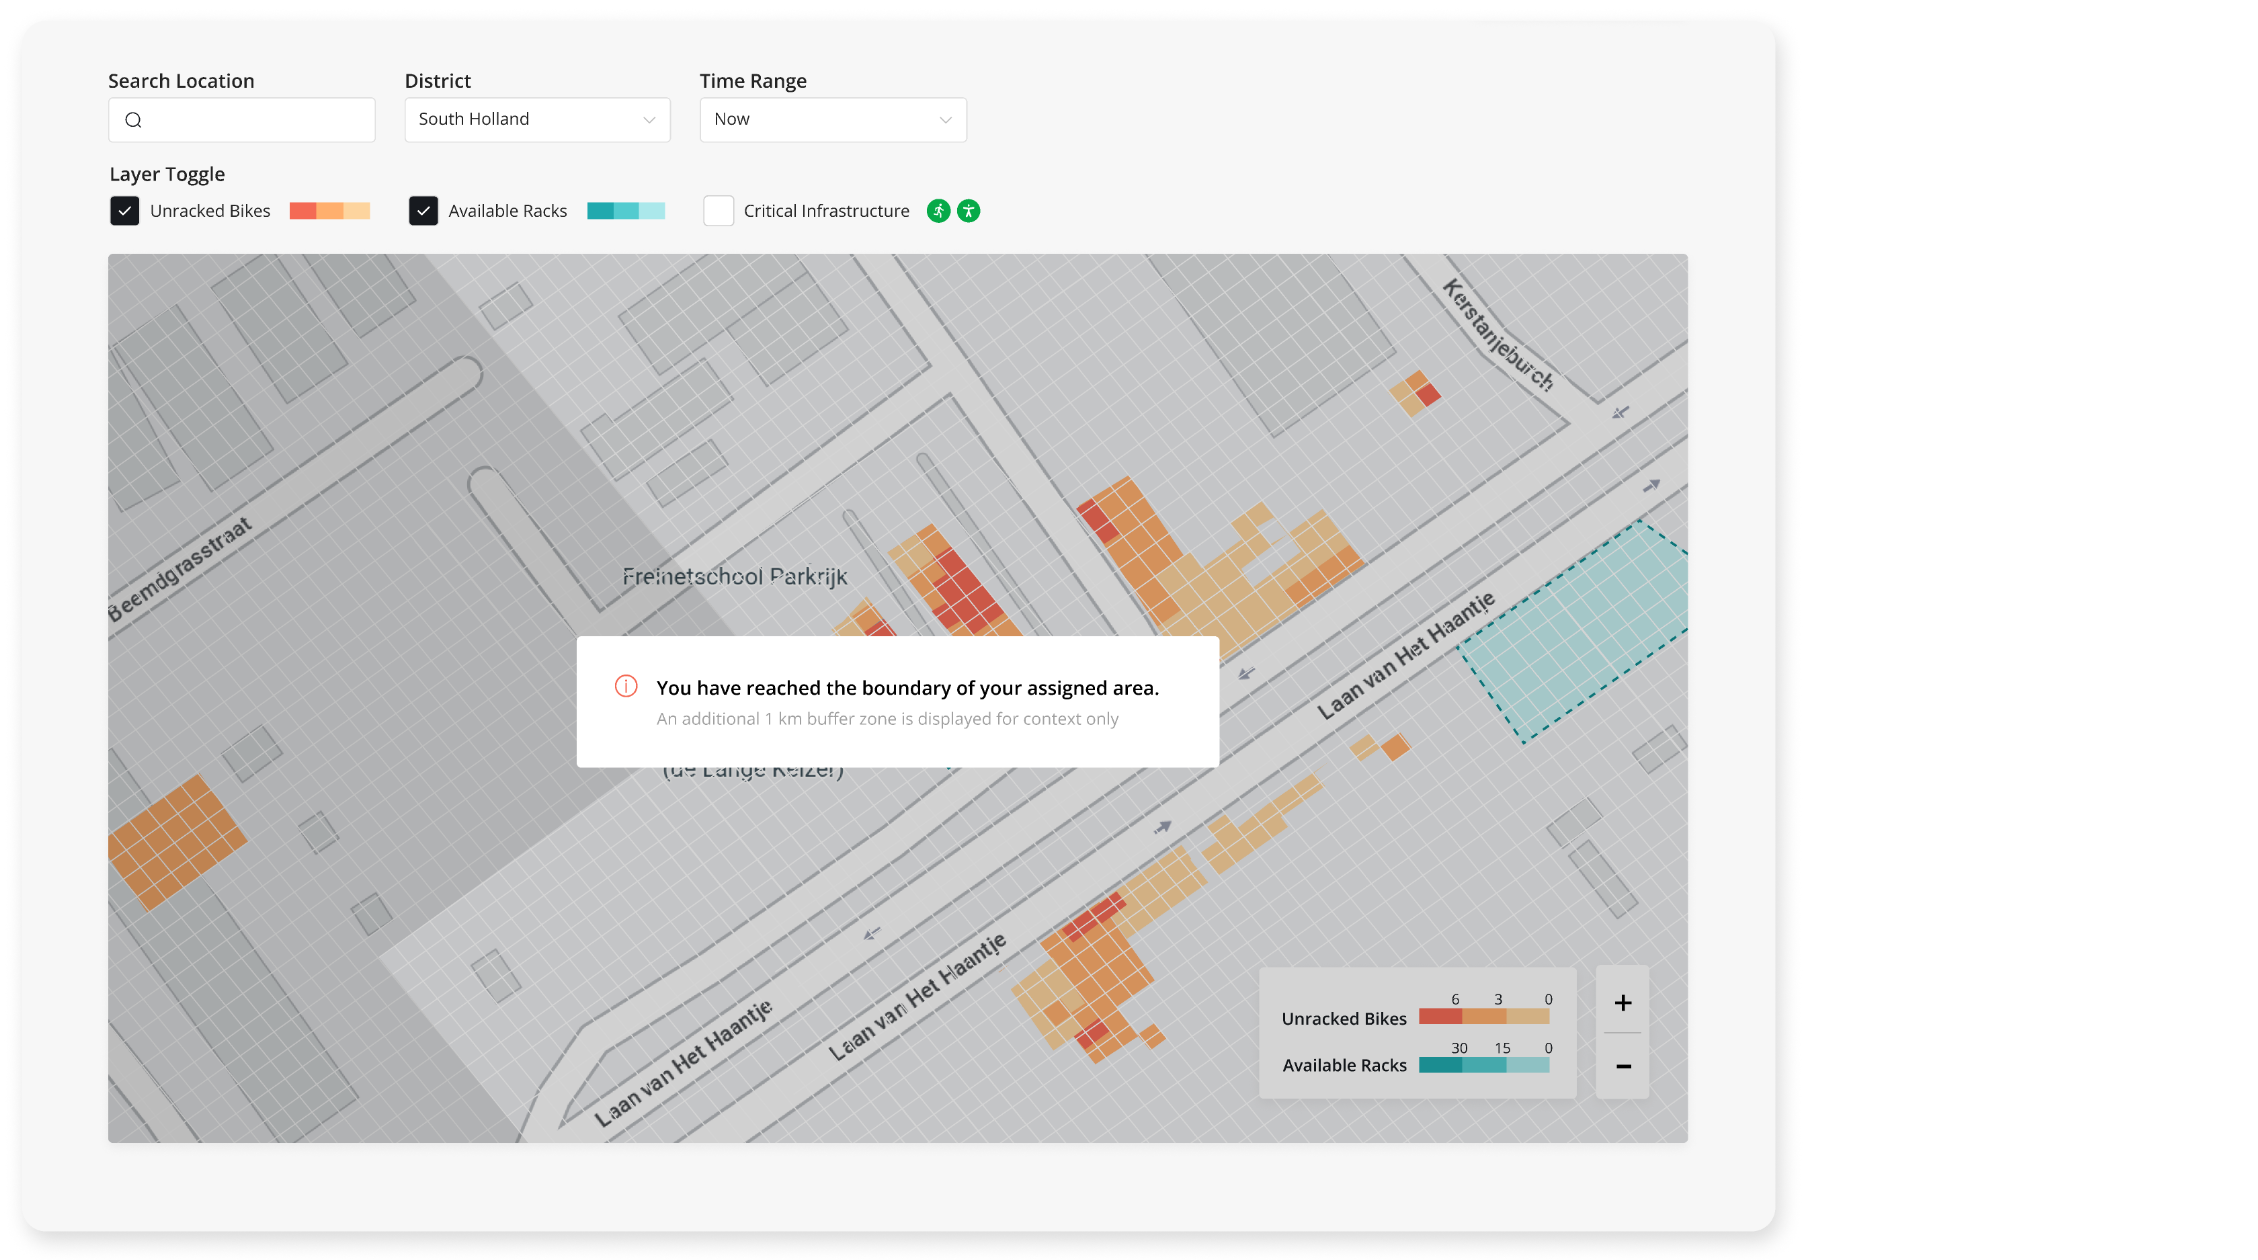
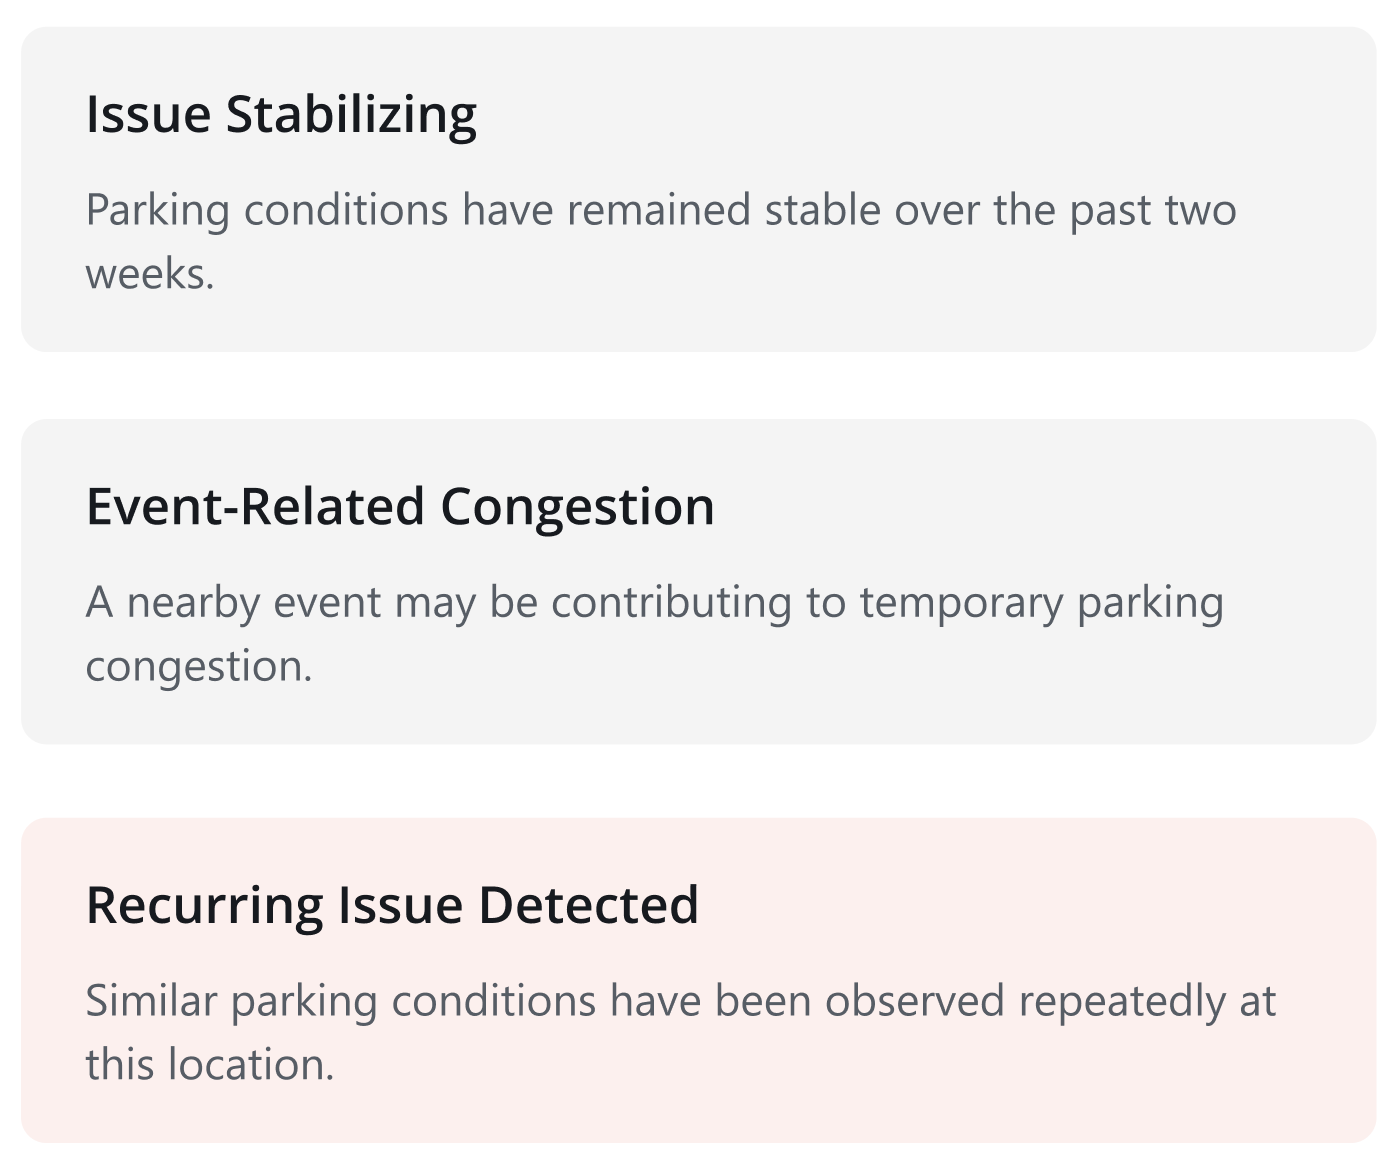
Automatically detect operational risks and patterns
Analyze parking conditions, safety risks, accessibility concerns, and historical trends to support faster operational decisions.
KEY DESIGN DECISION 04
Balance operational needs with technical constraints
Tech Constraints 01 & 02
Large-scale geospatial datasets; Multiple user groups and future framework expansion
TECH CONSTRAINT 01
Design for multiple user groups and future expansion
Prioritized Field Operator workflows in the MVP while establishing a scalable navigation framework for future stakeholder expansion.
TECH CONSTRAINT 02
Large-scale geospatial data impacts performance
Limited map rendering to the operator's assigned area while displaying an additional buffer zone for contextual awareness.
FINAL DESIGN
VALIDATION
2
Usability Testing with Operators
1
Stakeholder Review with Municipality
USER FEEDBACK
Users are pretty satisfied with the four key decisions
1. Monitor Overview
"I can identify priority areas within seconds instead of reviewing rows of operational data."
2. Locate Issues
"I finally have the spatial context needed to understand where the issue is occurring."
3. Automation Analysis
"I don't need to manually connect data points anymore. The system highlights the most important issues for me to review."
4. Create Task
"The recommended operator saves time and reduces the effort required to coordinate removals."
USER INSIGHTS
Users interpreted all hotspots as equally important.
Visual density does not communicate severity. Users needs more assistant to help them categorize the issue and organize the priority.
Critical infrastructure layer lacked sufficient context and explanation.
Safety and accessibility concerns were not always tied to a single point. Many represented routes, entrances, or operational zones that required spatial context to assess their impact.
IF I HAVE MORE TIME
More action suggestions for different spots
More detailed accessibility & safety map
VISION DESIGN
Explored simulation feature concepts by restructuring data inputs and outputs based on user goals and the UDES framework.
Guided Simulation Workflow for Scenario Setup and Pattern Analysis
- Fill in the parameters step by step
- Hover and click to fill in the parameter information
- Store simulation history in tabs
- Analyze the dynamic patterns of certain observation points assigned
Insights
It's important to help stakeholders see the long-term vision and potential of the platform. Even if some features are still far from being built, they can be valuable for communicating the roadmap and supporting marketing and sales conversations.
My Learning
Communicating Across Traditional Industry Stakeholders
Working with municipalities and parking operation teams taught me how to communicate complex design concepts in a practical and domain-specific context. They are super vague about their ideas, so we need to prototype first and let them correct us later.
Bridging Design and Engineering Through Close Collaboration
Working closely with engineers throughout the project strengthened my ability to translate user needs into technically feasible solutions. I learned how to align design decisions with system constraints while maintaining a user-centered experience.